Can machine learning help fix the carbon gap for markets?
An Emmi case study with Europes top 50 companies
Hello everyone,
With all the buzz around ChatGPT, what about tools for climate finance? Can machine learning help financial markets get better data to make decisions?
As ChatGPT shows, the application of machine learning to complex problems is immensely valuable - and at Emmi we believe it will transform our understanding of carbon in markets to help solve for big gaps in coverage, timeliness and consistency of data to make decisions.
So we’ve been collaborating with leading climate financial researchers from the University of Otago and Griffith University to research and develop machine learning algorithms to better predict corporate carbon emissions. We’ve found that machine learning can dramatically improve methods for estimating corporate carbon emissions in comparison to traditional methods.
In this newsletter I wanted to share what we have learnt and give you a working example of these machine learning predictions with the top 50 European companies. If you are interested in testing out our models for yourself- just hit ‘reply’ to me in your inbox or on our website here.
BACKGROUND
The Corporate Carbon Data Gap
For publicly listed companies, the vast majority (>90%) don’t report their operational carbon emissions (Scope 1 or 2). For unlisted companies and SMEs, carbon reporting is virtually non-existent so far. Global coverage of carbon emissions for companies does not exist. Predictive approaches for estimating carbon emissions are critical to fill the large gap for financial institutions and investors.
To overcome the carbon gaps for investors, traditional approaches tend to use sector averages or linear regression to fill carbon gaps. This is done by calculating the carbon intensity of revenue for sectors, then using revenue as a scaling factor to estimate carbon for missing data. This approach is the most widely used in the market and one is important to compare with.
MACHINE-LEARNING PREDICTIONS
A new approach to estimate company emissions
Machine learning is a catch-phrase for mathematical algorithms that ‘learn’ by classifying patterns in data for a given set of inputs and predictor variables. This algorithmic approach has the potential to find and extract the most predictive information from a given data-set. Overall machine learning has the potential to improve the quality of estimates with broader coverage. Is that true?
In partnership with our university partners, our data science team at Emmi have developed novel new machine learning methods to estimate corporate carbon emissions. If you want details about our approach, I’ve shared a summary at the end of this newsletter and you can also read two published research papers:
Key Finding from our Research:
Many of our best performing models (linear tree, gradient boost and meta-model) predict Scope 1+2 emissions for the world's largest companies within ~10%. This is a significant improvement from traditional methods that take sector-based averages and use revenue as a scaling factor. So let’s test it out with a case study.
CASE STUDY
Predicting emissions for the top 50 European companies
To help you understand our methods, we have applied our machine-learning algorithms to estimate emissions for the largest 50 companies in Europe for the year 2020. We can compare our predictions with reported numbers1 . Here’s what we found.
Scope 1 Emissions Predictions
Using our best models along with financial data for 2020 we predict Scope 1 carbon emissions and compare it to reported. I’ve charted our predictions and reported values for the top 20 largest emitters in Europe.
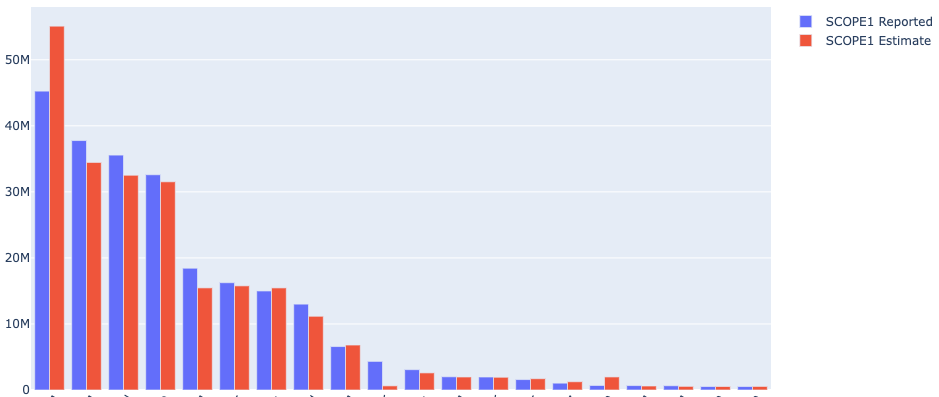
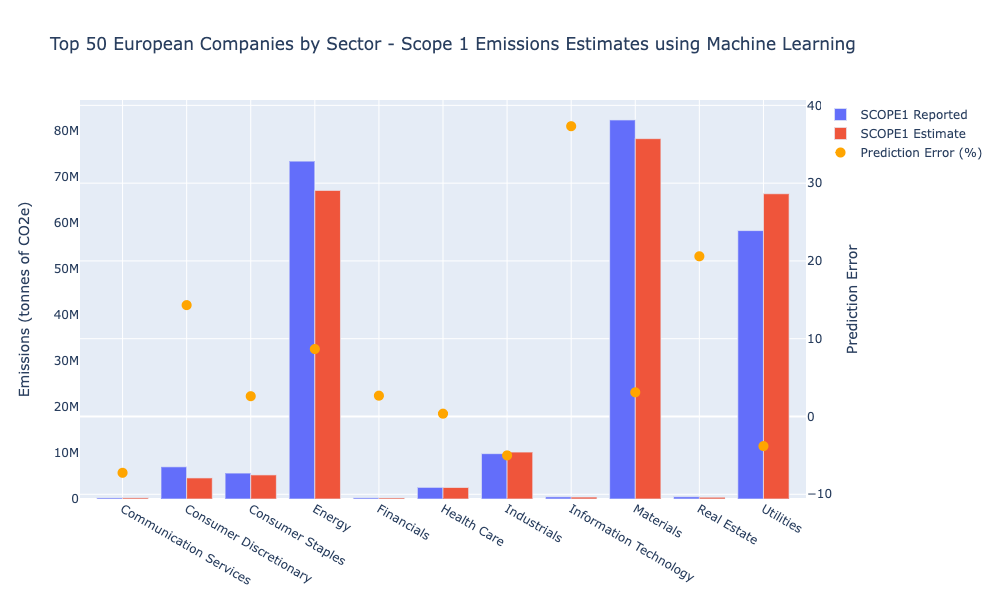
Across the 50 companies our models predict Scope 1 to within 11% MdAPE (median absolute percentage error) - similar to our overall research. Machine learning estimates tend to be slightly higher than reported values, (Figure 2), however breaking it down to the most influential sectors makes an important difference (Figure 3).
We find that sectors with highest aggregate emissions tend to have significantly higher predictive skill than sectors like IT or real estate that have a much lower magnitude of Scope 1 emissions. For example, prediction errors within the energy, utilities and materials sectors were within 2-6%.
Scope 2 Emissions Predictions
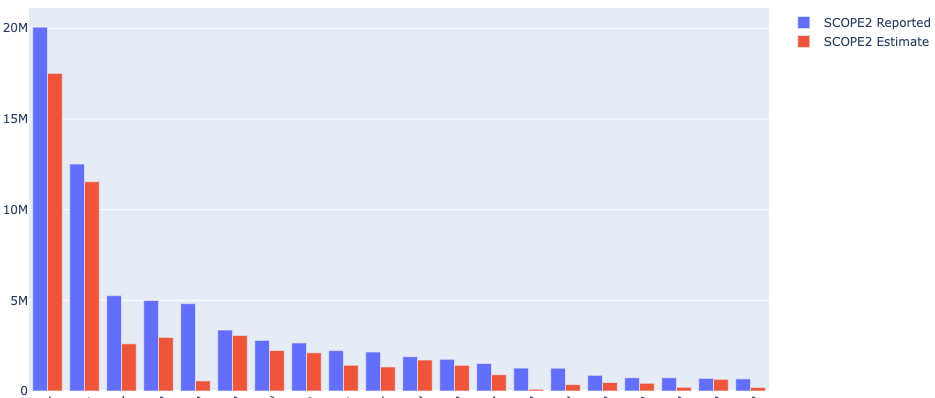
For Scope 2 emissions, the distribution of across the top 50 companies in Europe are quite different (Figure 4), with chemical companies contributing most due to their dependency on electricity and combustion for their processing.
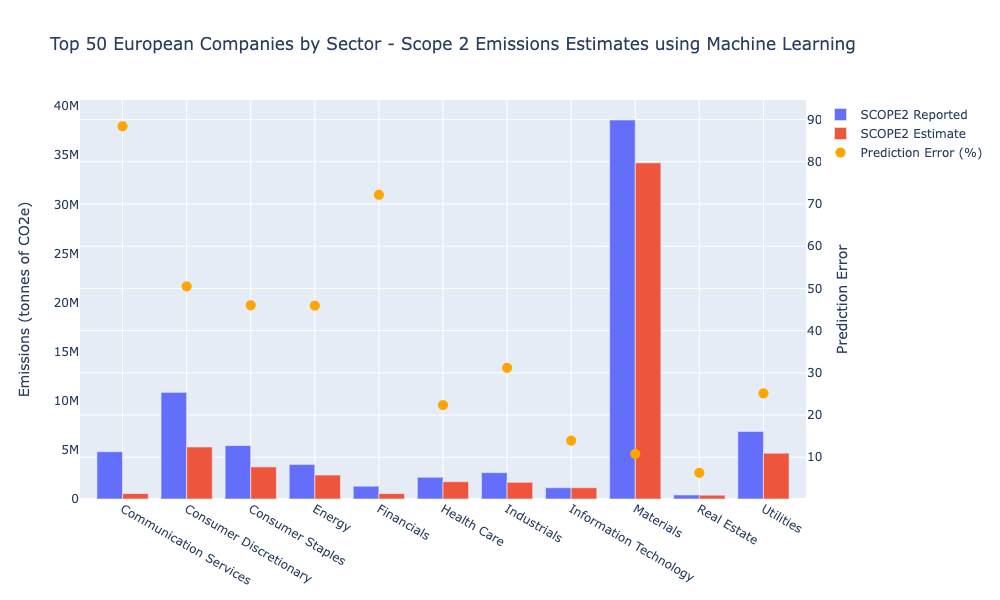
Similar for Scope 1, we find predictive skill to be higher amongst sectors with highest proportional emissions. For Scope 2, the materials sector contributes nearly half of the overall Scope 2 footprint, while our models accurately predict this sector to within 11%. This is a very encouraging result.
Beyond the materials sector, our Scope 2 predictions seem to underestimate reported emissions ~39% (Figure 5). Since 2020 was a unique outlier in terms of the global economy and energy use - this may partly explain this since patterns in the past may not be sufficient enough to predict trends in such an anomalous year. Despite this, we continue to improve the accuracy of all our models each year.
Most Influential Sectors
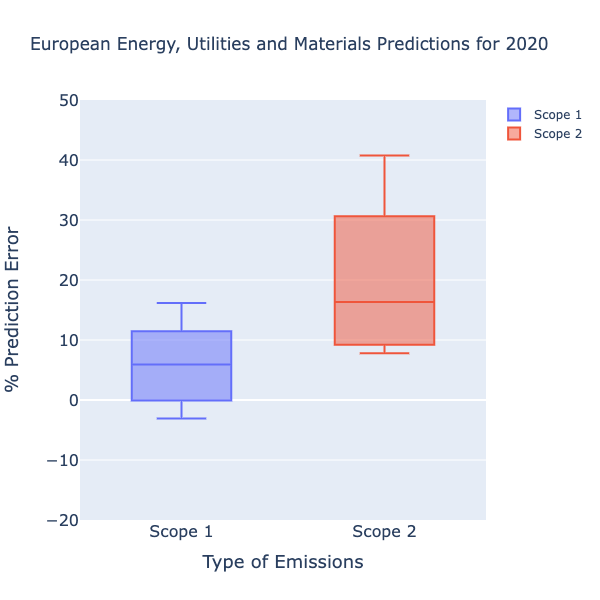
Our models work the best where it matters. The energy, utilities and materials sectors make up 90% of Scope 1 emissions and 60% of Scope 2 within Europes top 50 companies. For these most influential sectors, our machine learning models predict Scope 1 to within 6% and Scope 2 within 16% (Figure 6). These are encouraging and gives us confidence in applying our machine learning approach to both fill carbon gaps in coverage and timeliness.
Details of our Machine Learning Methods
What carbon data-set did we use?
Any data model requires a clean, robust data-set to ‘train’ the models. For our training data-set, corporate carbon emissions data between 2018-2021 were used for over 5000 companies via data providers (CDP and ISS). We sourced financial information for these companies via FactSet.
Often financial data reported from companies is incomplete. For example, revenue or employee numbers are missing. Ignoring this missing data limits the training data-set. To maximise the amount of training data used for our models we impute input financial data - which simply means we replace this missing data using more advanced imputation methods such as Multiple Imputation by Chained Equations (MICE).
What models were explored?
We applied a range of different machine learning models and found the best models include, Gradient Boosting, Random Forest, Linear Tree and a meta-model median of our best 5 models. We also optimised the hyperparameters of these models to obtain the most robust models. Here’s a quick summary of how the best models work.
Random Forest
A random forest is a type of classification algorithm made up of a collection of several decision tree models that work together to make predictions. Each decision tree in the random forest is built from a random sample of the data, and at each step of building the tree, a random subset of the features is considered for splitting the data. This means that each tree in the forest is different and is able to capture different aspects of the data. The final prediction is made by averaging the predictions of all the trees in the forest. This combination of many decision trees results in a model that is more robust and less prone to overfitting than an individual decision tree.
Linear Tree
Linear Trees combine the learning ability of decision trees with the predictive and interpretive power of linear models. Data is split using decision rules, similar to tree-based algorithms, and the quality of the splits is measured by fitting linear models at each node. This means that the models in the leaves of the tree are linear, as opposed to constant predictions as in traditional decision trees. Here’s a great write-up of this method.
Gradient Boost
Gradient boosting attempts to improve existing models by minimising a loss function that iteratively tests different sets of model input parameters known as hyperparameters, such as how deep a tree should go. The optimiser then runs the model many times with a different set of hyperparameters, and evaluate the performance of the model using a validation set. The optimizer will return the best set of hyperparameters that will be used to train the final model. This process can be computationally expensive, but it can lead to a significant improvement in the performance of the model.
What is a Meta-Model?
Our meta-models take the mean, median or max of the best 3-10 well trained models such as those described above. By combining the predictions of multiple models, the overall prediction accuracy and model stability is improved. By using the median of several predictions, the meta-model can effectively reduce the impact of outliers or individual model biases that may negatively affect the final prediction. This approach is better and more robust than relying on a single model, as it can help reduce overfitting and increase the generalisation and performance of the model. Furthermore, using multiple robust models can also help capture different aspects of the data, leading to a more comprehensive understanding of the underlying patterns in the data.
What predictors did you explore?
We explored 64 different financial predictor sets to test the skill of estimating Scope 1, 2 & 3 footprints for listed companies. Some predictor sets included Revenue, Country, City, Employee Number, GICS, Energy Use, Total Assets, Net Property, Plant and Equipment (NPPE), Capital Expense, Gross Profit, Operational Expense, EBIT, EBITDA, Net Income, Intangible Gross Debt, Capital Intensity, Asset Age, Costs of Goods, Total Debt, Current Liability, Current Asset.
How do you test the skill of each model?
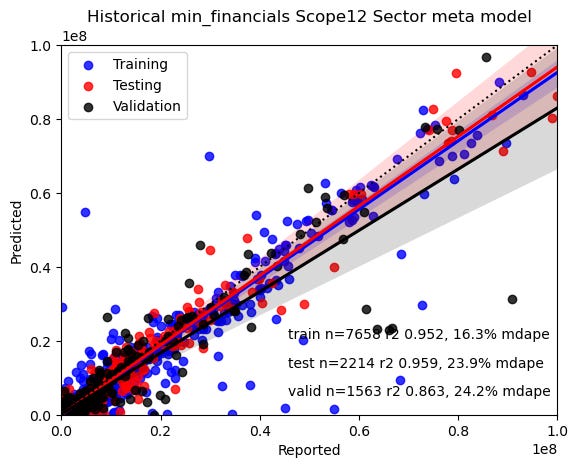
We used a training, testing and validation data split to ensure that 20% of the data was quarantined in order to independently validate the results. Here’s a visualisation of the carbon training reported versus predictions using three different models.
How do you choose the best models for a company?
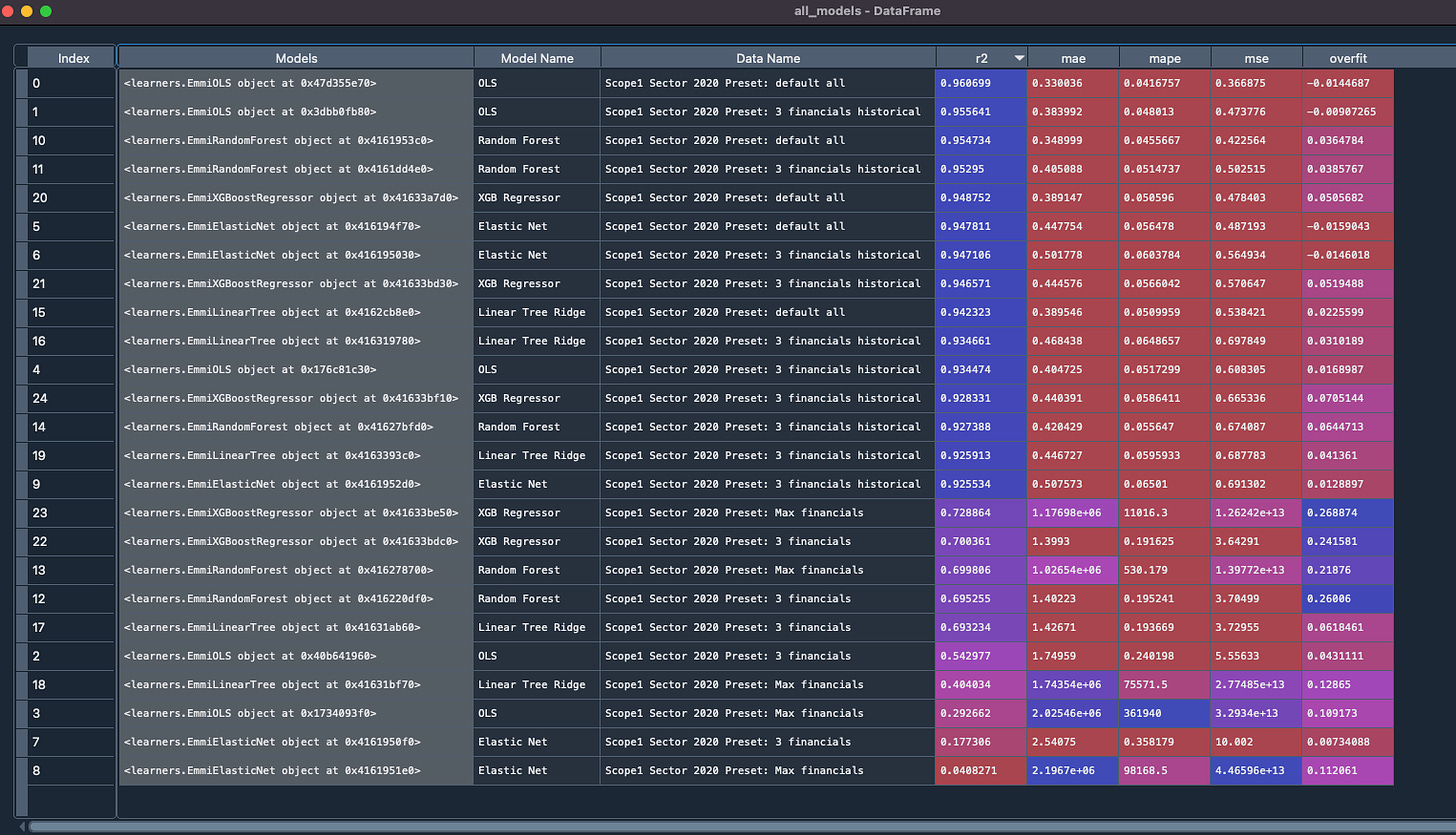
Each model and parameter set then competes with one another in a battle of the models. One of our data scientists Dr Nic Pittman has coined it ‘Fight Club’ for carbon. Here’s a look at our internal model setup showing ways we can assess model skill like r2 and Median Absolute Percentage Error ( MdAPE).
Want to test out our predictions?
We’re helping a number of financial institutions with their financed emissions and carbon transition pathways. If you are interested in talking to me and our team - just reply to this message or on our website here.
Thanks..
Ben
Reported carbon emissions for 2020 are taken from publicly available sources from company website reports. Eg for Enel https://www.enel.com/content/dam/enel-com/documenti/investitori/sostenibilita/ghg-inventory-2020.pdf


