What sectors are exposed to Scope 3?
Hello everyone,
Scope 3 emissions for a company are those indirectly produced by their customers and suppliers. So for a financial institution, Scope 3 is dominated by the direct emissions produced by their portfolio companies. For a gas company, Scope 3 is dominated by the burning of their products by their customers.
The new ISSB standards are mandating Scope 3 disclosures (remember you can get our free ISSB template here). The European Union, California, UK, Singapore, Australia, and New Zealand are requiring Scope 3 disclosures for both public and even private companies. The US SEC is currently discussing whether or not to mandate these disclosures too.
For investors, Scope 3 exposures are now important. What companies and sectors are most exposed to emerging Scope 3 mandates? In this weeks newsletter, I provide a simple way to look at Scope exposures using the Emmi emissions data for +45k public companies.
Quantifying Scope 3 exposures
In the past decade, regulators have focused on disclosures and reductions in a company’s Scope 1+2 emissions (direct operational emissions). For instance, in Australia, only the top 200 companies with high operational emissions are subject to emission caps. Companies that have high Scope 1 emissions include fossil-fuel electricity generation, steel production, or cement manufacturing - so regulators have focussed on them. However, service-based industries like finance, technology, and healthcare tend to have lower Scope 1 emissions and therefore faced minimal carbon risk in the past. With the latest regulation mandating disclosure of Scope 3 emissions, we now need to better understand which companies and sectors will be most affected.
Scope 3 Exposure Index
In order to analyse Scope 3 exposures, we can compare companies where Scope 3 emissions make up a larger percentage of their overall footprint compared to their controllable operational emissions (Scope 1 + 2). To determine this, I have calculated a Scope 3 exposure ratio by dividing Scope 3 emissions by the sum of Scope 1 and 2 emissions for each company.
A lower Scope 3 exposure ratio indicates that a company's operational emissions are greater than the indirect emissions from their customers or suppliers. A higher Scope 3 exposure ratio suggests that a business is more susceptible to carbon exposure from their customers' operational emissions.
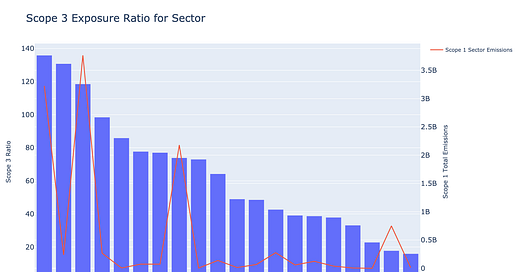
I’ve used Factset Sector classifications to show the mean Scope 3 exposure index across all 20 sectors (blue bars) and have also plotted the sector total Scope 1 footprint (red line).
The largest average Scope 3 exposures (>100) are for the Non-Energy Minerals, Finance and Utilities sector, while Transportation, Government and Communications have the lowest Scope 3 exposure. It’s somewhat misleading given the diversity of companies within each sector since cement is found in the broad sector of ‘Non-Energy Minerals’. So I’ve gone deeper to show the Scope 3 exposure index amongst the 130 Factset industry categories (chart below). This gives much clearer perspective - although apologies that you may not be able to read all the Industry classifications!
Overall, with the exception of 'Electric Utilities', industries with a higher Scope 1 footprint (red line) tend to have lower Scope 3 exposures (blue bars). In particular, banks, insurers and precious metals all have >300 Scope 3 exposures. You can read more why financial institutions have higher Scope 3 exposures in my previous article here.
On the other hand, heavy industries like Steel, Construction, Chemicals, Aluminium, Railroads, and Trucking have at least 10x lower Scope 3 exposures. This means the shift towards Scope 3 mandates will have lesser relative impact on these heavier industries than other industries.
Industries such as Coal and Integrated Oil do have lower scope 3 ratios than other industries, but it’s important to recognise they are being compared to a much larger scope 1 base. The scope 3 exposure ratio is most helpful when comparing with order of magnitudes of the underlying scope 1 emissions. Understanding the number of companies within a particular industry that share the emissions is also important. This all highlights the importance for investors to understand the level of risk within Scope 1, 2 and 3 - which I will write about in my next newsletter.
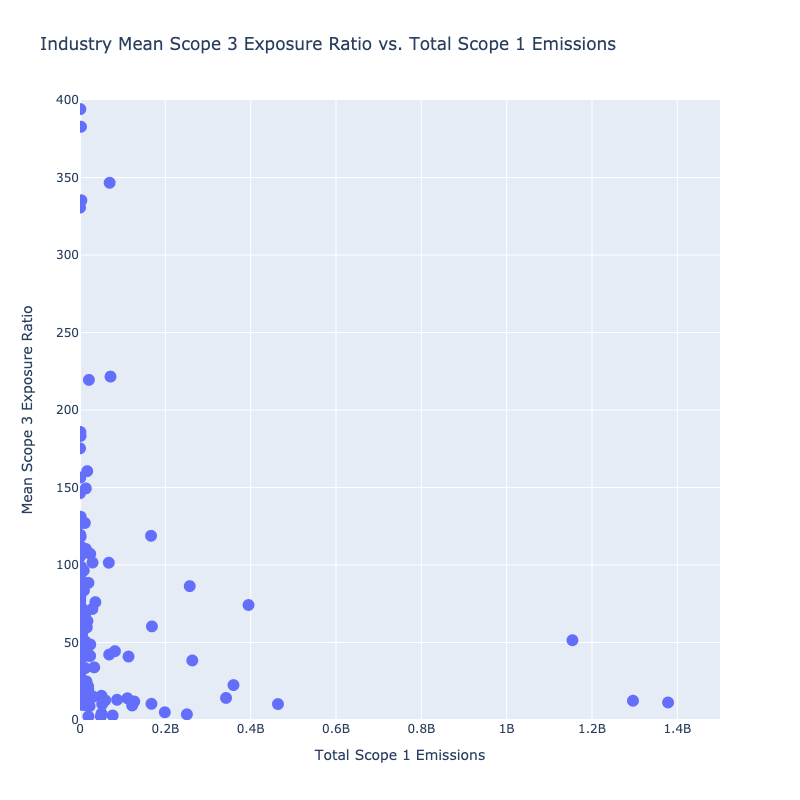
There is a clear inverse relationship between Scope 1 footprint and Scope 3 exposures (chart above). As carbon pricing and consumer demand for low-carbon products continue to shape the economy, sectors that are not typically considered high-risk in terms of carbon emissions will see their value decrease proportionately with the inclusion of Scope 3. For example, industries like Healthcare and technology may be classified as low-carbon, but with Scope 3 inclusions, their carbon footprint becomes more exposed compared to Scope 1 emitting sectors. As a next step, it’s therefore important to also analyze how potential climate scenarios and carbon pricing may materially impact these industries in the future (which will be discussed in my next newsletter).
Scope Exposures: Portfolio Example
Say we had a portfolio with three companies that included Airbus (European Aerospace Manufacturer), Linde (European Chemical Company) and Southern Company (US Electricity Utility). Total emissions are ~630 million tonnes in 2022 and lets say we’ve invested equally into each company across the fund. What happens to the portfolio carbon exposure if including Scope 3? I’ve created a bubble chart that shows the relative exposures across each Scope within each company of the portfolio.
As you can see, the carbon exposure depends heavily on the type of Scope that is taken into account. When only Scope 1 emissions are considered, Southern Company, a gas utility, holds the largest share of exposure across the portfolio. However, when Scope 2 is included, the exposure shifts to Linde, a chemical company that heavily relies on electricity in their operations.
Notably, without taking Scope 3 into consideration, the main drivers of exposure are companies that directly emit Scope 1 emissions, such as utilities and chemical companies. But once Scope 3 is factored in, Airbus emerges as the most significant contributor to exposure, as most of their emissions originate from downstream usage of their products by governments and airlines. Including Scope 3 makes a huge difference to the exposure of this portfolio.
Scope 3 is not just an added mandate for reporting standards, it will fundamentally alter where climate transition risk lies within a portfolio. In a follow-up newsletter I will go into the details in how including Scope 3 fundamentally alters the carbon risk and liability landscape for investors.
Thanks for reading.
Ben


